1
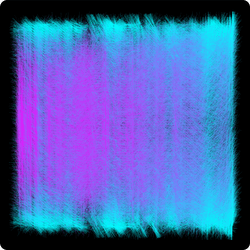
X coordinate : 1 week highest price/lowest price ratio
Y coordinate : Next interval return
Color mapping : Interval return
Line slope : Perpetual premium index
Useless is a generative art collection created using bitcoin market data by a quantitative researcher and an artist, Chiko. To the artist, data are essentially traces of human actions, thoughts, and emotions preserved in the form of 0s and 1s. The collection seeks to capture intense emotions and experiences of participating in the market. From it, the artist invites viewers to have a moment of self-reflection on their investment experiences and the emotions they felt during those times.
[For more Info.]
Twitter(X.com) https://twitter.com/lazy_chiko
Webpage https://chiko.art
Catalouge(47page) https://www.chiko.art/catalogue2309.pdf
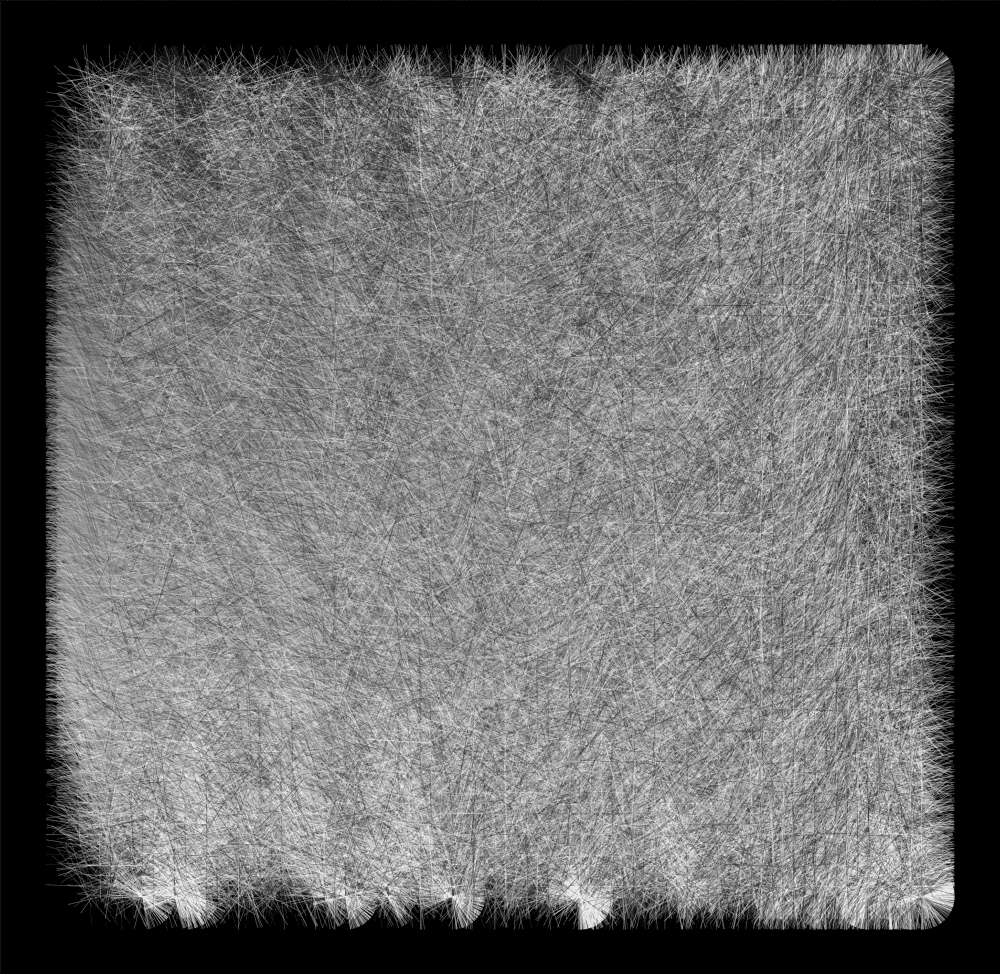